Nagios: An Opensource "Availability" Tool
Confidentiality, Integrity and Availability - these make up the CIA Triad upon which most Information Security programs are based. However, it seems that most folks outside of the infosec profession (and some within) only see the first one or maybe two as a truly infosec focus.
The third leg of the triad - availability - is self-explanatory. Applied in the infosec realm, it means that your resources (network, phones, databases, website, workstations etc...) are there and ready to serve when called upon. Often times, IT shops are told that an outage is occurring by their supported users before they are even aware of the problem. There are many reasons for this, and I won't jump onto that soapbox just yet, but often it stems from not having situational awareness.
So, how do you assure availability? The first step is to know what resources your business relies upon. Make a list, check it twice and then vet it with the system or business owners to verify your findings. Next, expand that list to the underlying dependencies required to support these resources. Take your time in this step and apply the OSI model, the rewards will come in spades if you do it right. Case in point - simply checking to see if a mail server replies to a ping does nothing to indicate if SMTP or IMAP are available. So if the business owners say that life ends when email stops - make sure you are not just looking to see the the mail server is pingable....delve into the lower level dependencies.
Now that our list is a 20 page printed spreadsheet of resources and dependencies, how do we track them all in real time? Well, you could go to the business owners and ask for more FTE dollars, or you could take a spare machine, install your favorite linux distro and setup Nagios.
"Nagios is a host and service monitor designed to inform you of network problems before your clients, end-users or managers do. It has been designed to run under the Linux operating system, but works fine under most *NIX variants as well. The monitoring daemon runs intermittent checks on hosts and services you specify using external "plugins" which return status information to Nagios. When problems are encountered, the daemon can send notifications out to administrative contacts in a variety of different ways (email, instant message, SMS, etc.). Current status information, historical logs, and reports can all be accessed via a web browser."In my test, I installed Fedora Core 6 and followed the "Quick Start" guide provided on the Nagios website. In about 15 minutes I had Nagios monitoring the local host on which it was installed. A few hours later we had all of our servers (and key services) and switches (and key ports) monitored.
Nagios, uses configuration (*.cfg) files to define objects like contacts, hosts, services, switches etc.. These can be as limited or elaborate as you want them to be. However, most of the work is done for you during the quick start which will get you up and running. Additionally, most of the common services are covered with the packaged plugins and agents. For more advanced monitoring you can find custom modules, say for monitoring a specific port on a Cisco switch, online at places like here or here.
Nagios doesn't stop at monitoring electrons, either. In fact, there are several products available (for a cost) to monitor the physical environment that are supported by Nagios plugins. For example, the Websensor EM01B is capable of monitoring for temperature, liquid presence, illumination (light level) and relative humidity. Perfect for a server room or wiring closet. Look back soon for a test on this specific product.
 The final piece that makes Nagios so useful is the included web interface. While it is not a work of art, it is a functional tool that allows viewers to quickly scan the whole, or micromanage the specific. My favorite experience so far with this product stemmed from a recent downtime in which we upgraded the power in our server room. Once we completed the work, we were able to tune into the Nagios web interface to check our status. We found only one issue (SMTP was timing out on a mail server) and were able to focus on that specific issue rather than checking on everything that we thought we needed to. Once we got that issue sorted out, we got the final recovery alert telling us that SMTP was "OK." Here are a few screen shots from the Nagios site to help highlight the functional form of the we interface:
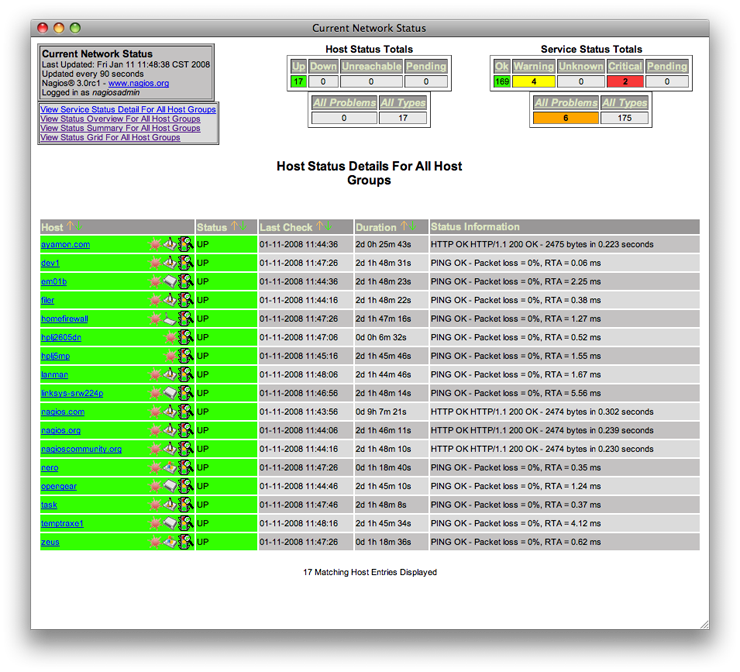 First the Host Detail: A quick and dirty table that will give you a listing of your defined hosts and their statuses. In Nagios, each system is referred to as a host (be it a server, a switch or external device) and these hosts can have services. Agents are available for several operating systems that allow for a more granular interface. Think monitoring key Windows services.
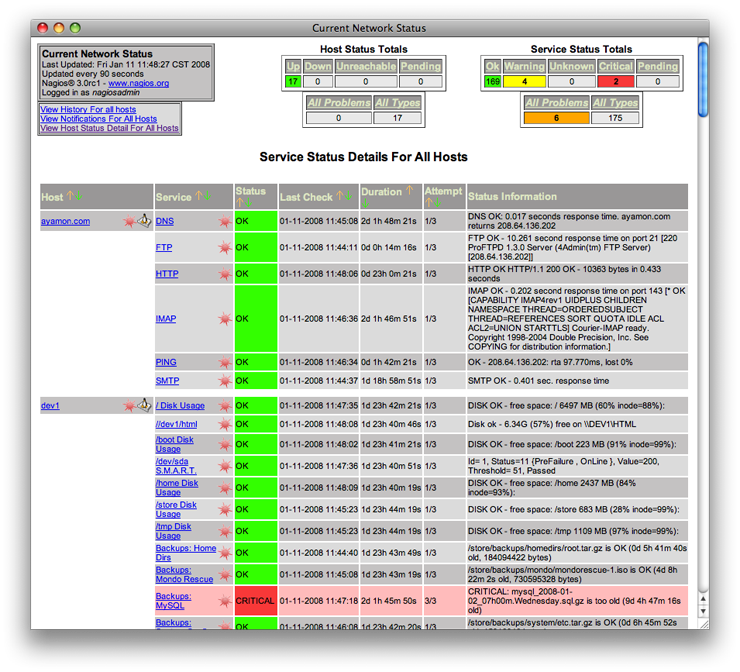 Next the Service Detail: Here the table is sorted by Host and then by service. Look closely and you can see the amount of detail being filtered into the system by the plugins and configurations.
Nagios also offers the ability to group hosts and services so that you can quickly view large portions of your network availability status by group type. Here we see the Host Group Overview page. One of the neater features is the ability to establish parent/child relationships within the hosts and services which allow for extended alerting. For example, if our WAN link ports go down, the parent, several other services are alerted on as children.
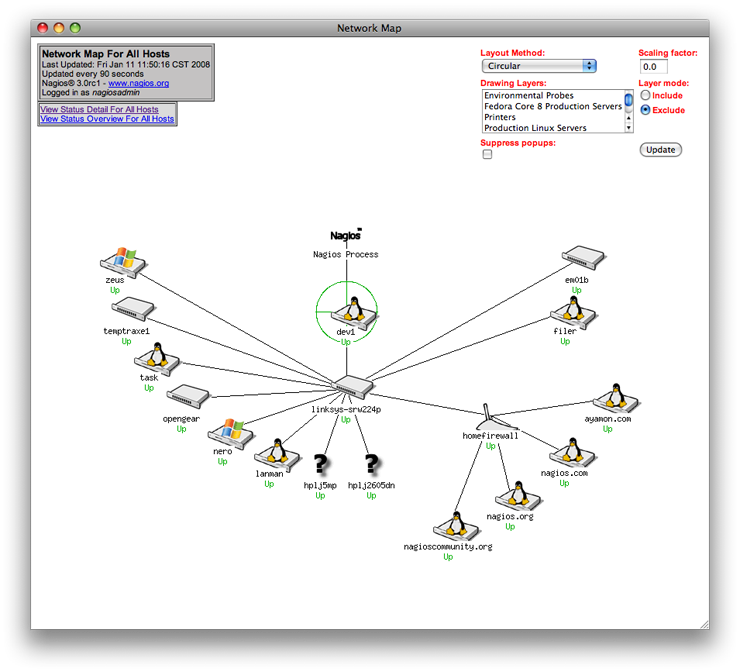
Last the Status Map: This is just plain cool if you ask me. It's a nice array that you can have running on a secondary/tertiary monitor all day long.
Some words of caution - when installing on a SE Linux kernel, there are a few more steps to make Nagios work completely. Sure, you can use the "setenforce 0" command to stop SE from getting the way, but I would recommend following the steps in this guide. Next, always check your newly created or edited configuration files for errors or conflicts before restarting Nagios. Pre-packaged with Nagios is a script to do just that. Last, remember that throwing technology at the problem is rarely the complete answer. You still have to check that Nagios is checking - and its results have integrity.

No comments:
Post a Comment